PHaRLAP + IRI 2D and 3D Ray Trace
3D Geoplot3 Status
The MATLAB geoplot3 output path is WIP and environment dependent.
It requires Mapping Toolbox and display functionality. In headless mode, TRACE falls back to MATLAB plot3 ECEF rendering.
End-to-End Example: Density Model to Ray Path Plot
Uses IRI + NRLMSISE background inputs, runs PHaRLAP, and visualizes ray trajectories over ne_grid.
This page explains the example script:
examples/run_pharlap_iri.py
It is an end-to-end wrapper that prepares ionosphere/background inputs, runs PHaRLAP through MATLAB Engine, and plots ray paths over the IRI electron density field.
PyIRI Backend Config
TRACE now uses PyIRI for IRI density fetch (PyIRI.sh_library.IRI_density_1day).
Use iri_param in hfpytrace/cfg/config2D.json:
iri_version is deprecated and ignored by the current backend.
Call Flow
main()parses CLI args (--config,--event,--no-matlab) and loads config._run(...)prepares all model inputs:- route and bearing (
build_route_from_cfg) - height grid (
build_heights_from_cfg) - elevation fan (
build_elevations_from_cfg) - frequencies (
build_freqs_from_cfg) - IRI density is fetched via
IRI2d.fetch_dataset(...)intone_grid(2D) and can be extended for 3D grids. - Collision frequency is computed from:
- NRLMSISE-00 neutral background (
ComputeCollision.from_nrlmsise) - simple plasma defaults (
Te,Ti,Op,O2p) derived in script - PHaRLAP is run via
Engine.run_pharlap(...). _plot_ray_paths(...)overlaysray_path_data[i].ground_rangevsray_path_data[i].heightonne_gridusingPlotRays.
Key Code (From run_pharlap_iri.py)
1) Grid Construction and IRI Fetch
n_range = int(cfg.number_of_ground_step_km)
lats, lons, rb, route_km = build_route_from_cfg(cfg, n_range)
heights = build_heights_from_cfg(cfg)
iri = IRI2d(cfg, event_time)
ne_grid, _ = iri.fetch_dataset(event_time, lats, lons, heights)

elevs = build_elevations_from_cfg(cfg)
freqs = build_freqs_from_cfg(cfg, elevs)
range_inc = float(route_km) / max(ne_grid.shape[1] - 1, 1)
height_inc = float(getattr(cfg, "height_incriment_km", 1.0))
2) Collision Frequency (NRLMSISE-Driven)
te_grid = np.full_like(ne_grid, 1000.0, dtype=float)
ti_grid = np.full_like(ne_grid, 1000.0, dtype=float)
op_grid = 0.9 * ne_grid
o2p_grid = 0.1 * ne_grid

cc = ComputeCollision.from_nrlmsise(
    date=event_time,
    lats=lats,
    lons=lons,
    heights_km=heights,
    Te=te_grid,
    Ti=ti_grid,
    edens=ne_grid,
    O2p=o2p_grid,
    Op=op_grid,
    update_spaceweather=False,
    suppress_spaceweather_warning=True,
)
collision_freq = cc.collision.nu_ft
3) PHaRLAP Call
engine = Engine()
try:
    ray_data, ray_path_data = engine.run_pharlap(
        ne_grid=ne_grid,
        collision_freq=collision_freq,
        elevs=elevs,
        rb=rb,
        freqs=freqs,
        irreg=irreg,
        nhops=int(cfg.nhops),
        tol=float(getattr(cfg, "threshold", 1e-7)),
        radius_earth=float(cfg.radius_earth),
        irregs_flag=0,
        start_height=int(round(float(cfg.start_height_km))),
        height_inc=int(round(height_inc)),
        range_inc=int(round(range_inc)),
    )
finally:
    engine.close()
4) Plotting ray_path_data Over ne_grid
X, Z = np.meshgrid(np.linspace(0.0, route_km, ne_grid.shape[1]), heights)
rays = []
for r in ray_path_data:
    rays.append(
        SimpleNamespace(
            x_km=np.asarray(r.ground_range, dtype=float),
            y_km=np.asarray(r.height, dtype=float),
            el0_deg=float(r.initial_elev),
        )
    )

rp = PlotRays(oth=False, xlim=[0.0, float(route_km)], ylim=[float(heights[0]), float(heights[-1])])
rp.set_density(X, Z, ne_grid, pf=None)
rp.lay_rays(outputs=rays, kind="edens", lcolor="k", lw=0.6, param_alpha=0.85)
rp.save("pharlap_iri_ray_paths.png")
rp.close()
Run
From repository root:
To validate setup only (skip MATLAB execution):
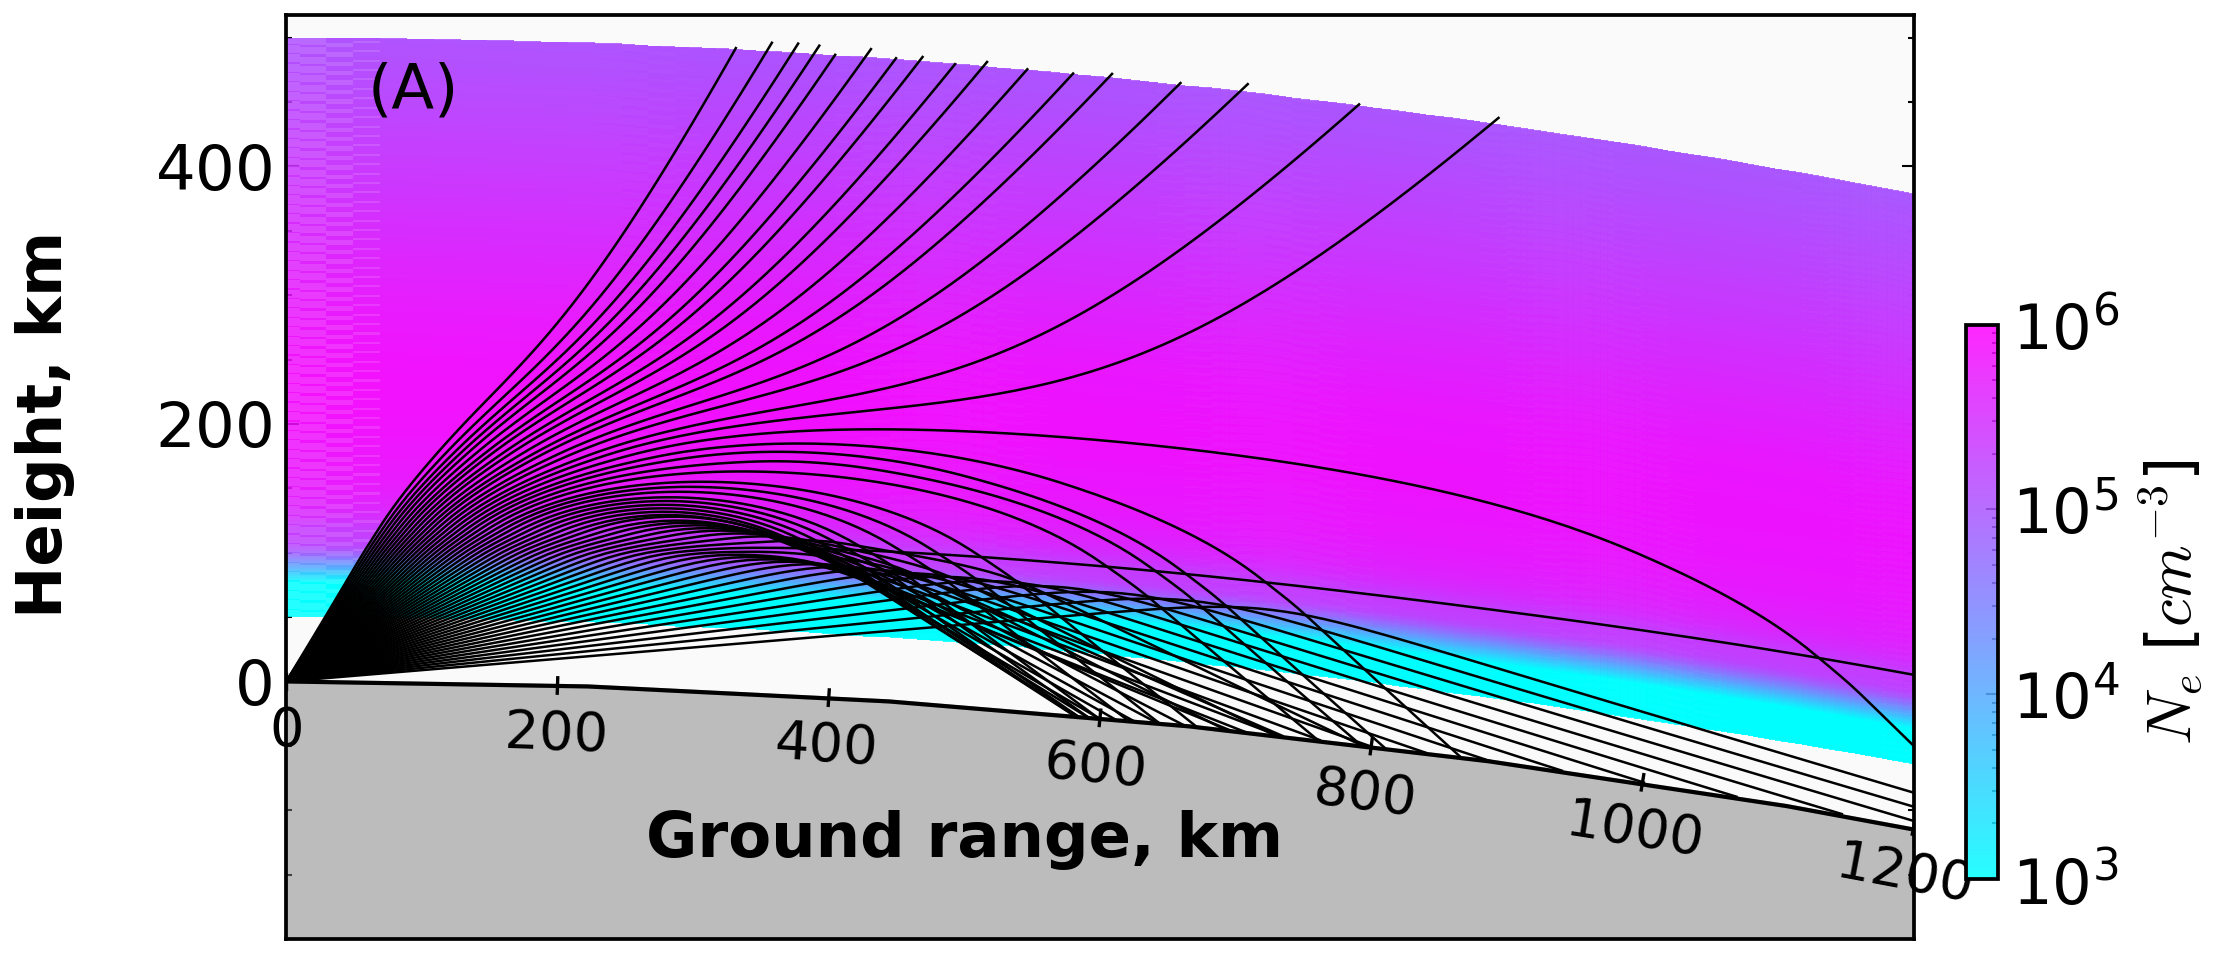
Output Figure
Saved figure:
pharlap_iri_ray_paths.png
Rendered example image:
Related Files
examples/run_pharlap_iri.pyexamples/run_pharlap_iri_3d.py(3D companion)hfpytrace/pharlap.pyhfpytrace/collision.pyhfpytrace/plottrace.py